

The Signals That Caught Our Eye
Nonprofits make up nearly three quarters of our partners at YMCA WorkWell, and in the last 12 months, we collected employee experience and demographic data from nearly 14,000 nonprofit employees working across more than 60 nonprofit organizations across every province in Canada. While every organization has unique needs, just like every employee, there are important stories that only emerge when you view data across the entire sector at that scale.
And one trend that has caught our eye for some time is the well-being of women in the nonprofit sector, for a number of reasons.
We've noted that women make up a huge majority of the nonprofit sector, and 80% of our sample identified as women - 80%! Take a moment to imagine what that actually looks like in practice. If you were giving a town hall to 1,000 Canadian nonprofit employees from this sample, 801 of them would identify as women, 12 would identify as non-binary or gender diverse, and only 187 would identify as men.
When we're talking about 80% of a workforce, it becomes clear that we can't talk about the well-being of the Canadian nonprofit sector without talking about the well-being of the women in it.
But this representation is only one piece of a deeper story, and it's what comes next that makes this such an important story to tell. You might assume that women would be thriving in a sector they power - or at the very least, faring no worse than their male colleagues. It's often the majority who set the tone in a workplace - but the more we dug into the data, the clearer it became that was not the case.
So let's dig deeper.
Leadership Representation
While women made up 80% of our sample, they were less represented at senior leadership tables. Women comprised 80% of front line roles and 81% of supervisory roles - but their representation started to decline as you move up the organization - dropping to 74% of director and manager roles and 70% in senior leadership roles (VP and C-suite).
It's worth noting: this representation outpaces broader national averages. The most recent Statistics Canada Labour Force Report found that only 30% of senior leaders in Canada are women - meaning there were more than twice as many women in senior leader roles in our data compared to the national average. That progress is worth celebrating, yet the trend remains clear: male representation grows progressively as decision-making power, and crucially, compensation increase in nonprofit roles.
Employee Experience
The disparity extends beyond representation, too. When we shift to employee experience metrics, nonprofit women trailed behind nonprofit men on many of the key well-being metrics we measure on our YMCA WorkWell Insights Survey.
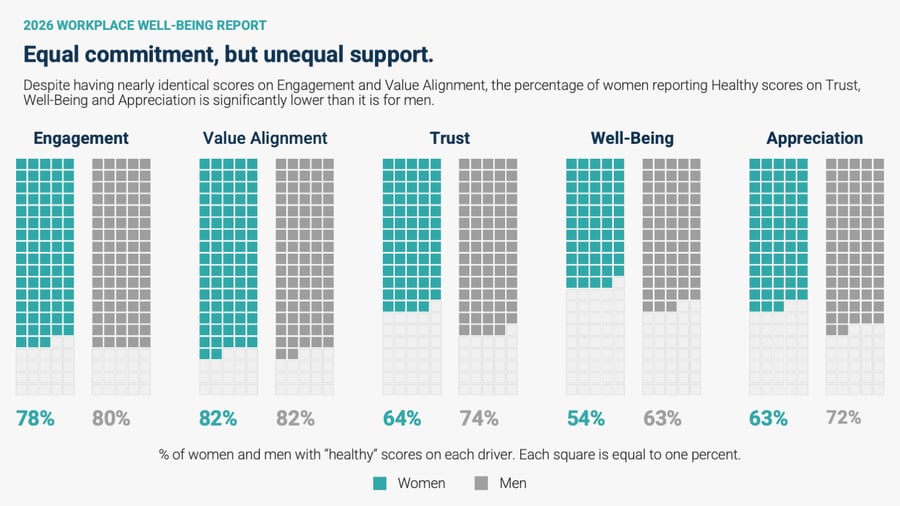
It's important to note: there are clear similarities. For example, the percentage of women and men with healthy Engagement and Value Alignment scores was nearly identical - right around 80% for both genders. This suggests that women and men are equally engaged by and dedicated to their missions. That feeling of purpose has never been a concern in our sector - regardless of gender identity.
However, that equal commitment is met with unequal support. Women scored significantly lower than men in critical areas like Trust (with 64% of women reporting healthy scores compared to 74% of men), Well-Being (54% vs. 63%), and Appreciation (63% vs. 72%). In other words, our data suggests that women in the nonprofit sector are equally as committed as men, but experience less trust, lower well-being, and less frequent appreciation for their work.
Burnout & Emotional Labour
Women also report more frequent burnout in our data - with 24% of women reporting burnout "often" or "extremely often", compared to 15% of men - and 3 in 5 women (59%) reporting burnout at least "sometimes". Flip that around and the gap is just as stark: men are 1.4 times more likely to say they never burn out at all - despite working comparable roles.
And there's another, quieter gap that is worth naming: the emotional tax. We asked nonprofit employees how much their interactions with the customers/community members they serve impact their personal well-being at work. More than 3 in 4 women (76%) said these interactions at least "somewhat" impacted their personal well-being, compared to 62% of men - highlighting an emotional labour load that women are more likely to carry in client-facing, care-giving work every day.
When you compile it all - there wasn't just one signal in our data. Despite making up the majority of the nonprofit sector, our data highlights multiple ways in which women still worse off when it comes to their actual employee experience. And that is exactly why this story matters.
Crucially, this isn't simply because women hold harder roles. When we account for role, department, tenure, and other factors, identifying as a woman in the nonprofit sector independently predicts a more strained employee experience. The gap holds.
The one exception occurs at the executive level, with senior leader women generally reporting outcomes that are more similar to those of senior leader men. The most significant gaps pool in the "squeezed middle" - women supervisors and managers who experience both front line strain and leadership pressures. It's here where the well-being gaps between men and women are the highest.
The Importance of Collecting New Voices
It's also important for us to hit pause. We know there is a limitation in our data because our nonprofit partners at YMCA WorkWell are not the norm. Our team supports employee well-being and culture - and that means that the organizations we partner with tend to have the kinds of leaders who are already investing in these areas.
That's not to say our partners don't have challenges - they still face the well-documented pressures affecting nonprofits across Canada. But they have leaders who care enough about their teams' well-being to take it seriously.
We know, unfortunately, that is not the reality in all nonprofits. That is important to consider when discussing sector-wide trends. If we want to tell the story of women's well-being in the Canadian nonprofit sector, every voice matters, not just those working for the organizations we are lucky enough to partner with.
So we captured more voices.

Collecting Broader Voices:
Under-Resourced, Burnt Out & Underpaid
To collect new voices, in partnership with The Women's Nonprofit Network, we launched a dedicated community survey focused on the unique needs of women and female-identifying employees in the nonprofit sector that our standard Insights Survey doesn't reach. Areas like financial security, caregiving responsibilities, life outside of work, and what it actually feels like to be a woman building a career in this sector.
In total, we heard from 892 women and female-identifying people working across the Canadian nonprofit sector, with responses collected from every province and territory in the country. In this sample, 98% identified as women, with 2% identifying as both women and non-binary. One in five (20%) identified as racially diverse, and 15% identified as 2SLGBTQIA+.
It's always worth noting: this was a voluntary community survey, which brings its own biases in who responds - particularly towards people who have strong feelings on the topic. This sample was relatively experienced (51% had spent more than a decade in the sector) and mid-career (74% were between 30 and 59), with many working in small to mid-sized nonprofits (40% worked at organizations with less than 40 employees), and over half (55%) held leadership roles from supervisors to senior leaders.
There are many stories in this data, but we've chosen to focus on the most compelling and important ones rather than burying you with graphs. So let's return to what might be the key paradox at the centre of it all: the stark difference between value alignment and well-being in nonprofit women.
The Purpose Vs. Support Paradox
When we asked nonprofit women to rate their value alignment ("The mission and values of my organization resonate with me"), an astounding 82% reported healthy scores - 82%! Only 6% reported unhealthy scores. That is a remarkable level of value alignment that likely isn't a surprise to anyone working in the sector. Spending your days helping those in need generates a great deal of meaning and alignment - that is the passion that drives our sector.
And yet, the traditional models of employee engagement suggesting that strong value alignment will lead to a happy and healthy employees fall short here - 82% of respondents reported healthy value alignment scores and less than half that number reported healthy well-being scores ("Thinking back on the last three months, I feel as though my well-being has been supported at work").
Only 40% felt that their well-being had been adequately supported at work in the last three months. Less than half! Even among the 82% with healthy value alignment, less than half (46%) reported a healthy well-being score.
Take a moment to sit with that: more than half of the women who were fully bought into their organization's mission were running on empty and not feeling like their well-being was supported at work. That is a real indictment of the sector.
And the story doesn't change once we look at burnout in this sample - 38% of the women we surveyed experienced burnout "often" or "extremely often" in the last three months. That is nearly double the rate we see in our WorkWell data. When we include those reporting burnout "sometime", the number jumps to 74%.
That is 3 in 4 women in the nonprofit sector reporting at least semi-regular burnout - a sobering statistic, and a sign that something has to give if we are looking to provide a healthy employee experience to women in our sector.
The Root Causes of Burnout
Shining a light on burnout is important, as it highlights the scale of the issue. But equally important is understanding why burnout is so prevalent in women and female-identifying people in the nonprofit sector. So we did what you'd expect any researchers to do: we asked them.
We asked respondents who were experiencing burnout at least "sometimes" to identify their primary sources of stress at work from a list of 18 stressors. Stressors that the literature highlights as key sources of burnout like workload, compensation, a lack of recognition, and a lack of role clarity.
The top five responses paint a clear picture of a caring, but overworked and under-resourced workforce.
The top stressor identified by burnt out women was feeling too under-resourced to achieve their mission - and that explains the paradox. Even if we stopped there, it's telling that the top stressor references being both under-resourced and the ability to achieve their mission - and it helps explain this paradox between high value alignment and high burnout.
Decades of organizational research demonstrates that high value alignment is a significant source of job satisfaction (here's a meta-analysis of 172 studies if you really want to dig in). In the nonprofit sector, it helps employees find significant purpose and meaning in their work, and creates a real sense of urgency in achieving a mission that matters. When you care so much about the mission, however, it is particularly taxing when you don't have the resources to make real progress. It's the stress of impact being left on the table every day in a sector where you care so deeply about your mission.
As we round out the rest of the top five, the picture becomes even clearer. Unsustainable workloads (56%), inadequate compensation (51%), inadequate appreciation (43%) and personal perfectionism (40%) were all cited by at least 2 in 5 burnt out respondents.
Consider these stressors together and the experience it creates. Women in the nonprofit sector care so deeply about their missions, but feel so under-resourced in their roles that they often take on significant workloads in an attempt to accomplish them - driven by their own high standards to do the work right. All the while, not feeling appropriately compensated or appreciated for how much of themselves they are giving to the cause.
It feels impossible to build a sustainable sector when that experience is the norm for so many of the people powering it. And that "so what" is spelled out quite clearly in the data too - both at the individual level and the sector-level.
Understanding the Impact: Financial Precarity
Let's start with a harsh reality: People typically choose to work in the nonprofit sector for the impact, not the compensation - something that has been labeled a "passion tax". Research has demonstrated that framing a job around "making the world a better place" leads candidates to accept lower pay, and people see it as more legitimate to ask passionate workers to take on more work for less. We see this clear as day in the Canadian nonprofit sector.
For example, Imagine Canada reports community nonprofit employees earn 31% less than the national average - almost $20,000 a year less. Ontario Living Wage Network outlines how the sector's average wage does not clear a living wage in Toronto, despite the fact that nearly three quarters of nonprofit staff hold some form of post-secondary education, significantly higher than the average across the Canadian economy (56%).
These challenges are even more pronounced for the majority of women who make up the sector. Imagine Canada reports that gender pay gaps account for much of the sector's wage deficit, with the gap between nonprofit salaries and the average Canadian salary being 6x greater for women compared to men. Charity Village reports that female nonprofit CEOs earn 20% less than their male counterparts, and 4-13% lower across other management levels.
For many women in our sector, this translates into real financial precarity - and we see that in our data too.
Across our entire sample, 62% of respondents - almost 2 in 3 - reported at least one indicator of financial precarity. For example, in the 12 months prior to the survey:
-
- 43% had felt like they were living with ongoing financial instability
- 33% had foregone retirement savings due to financial pressures
- 29% had delayed or skipped medical care because of the cost
- 28% had worried about meeting basic needs
- 18% had worked more than one job to make ends meet
- 43% had felt like they were living with ongoing financial instability
Think of that in context: ten nonprofit women walk into a meeting. Based on this data, six of them are living with some degree of financial precarity - whether that's having stopped saving for retirement, skipping care they've needed because they can't afford it, or working other jobs to make ends meet. This is the hidden cost of the passion tax - and it is being paid by hundreds of thousands of women in our sector.
The data is even more stark when you focus specifically on front line employees and supervisors. If you click on the "Front Line & Supervisors" button in the figure above, you'll see that 72% of the women in front line and supervisors roles reported at least one indicator of financial precarity, 3 in 5 felt like they were living with ongoing financial instability, 1 in 2 had worried about meeting basic needs, and 1 in 4 had worked more than one job to make ends meet. And for anyone who believes that leaders are immune from these challenges, 1 in 3 senior leaders, directors and managers felt like they were living with financial instability and reported foregoing retirement savings due to financial pressures.
That is a lot of data, so let's put it plainly:
Women in the nonprofit sector are regularly battling financial insecurity - and it's not just a front line challenge. It affects women throughout the sector - even in senior roles.
Now when you consider that 38% of nonprofit women are burning out frequently, while simultaneously absorbing significant financial strain at home - that is a true sector-wide crisis. Beyond the anecdotes, the data shows that women in this sector are underpaid, under-resourced, and burnt out.
Primary Predictors of Financial Strain & Burnout
It's also important to highlight some important differences we see in the data - because the data suggests that some women face greater risks than others. It's worth commenting on what the data does and doesn't say: when you look at the data in isolation, there are definite demographic signals around areas like race, sexual orientation, and disability - however, when we test the data rigorously, there are two factors that clearly stood out above all the rest in predicting financial precarity and burnout.
1. Whether they have a partner at home
One factor stood out above all the rest when it came to predicting financial precarity and burnout in nonprofit women, and that was whether they lived with a partner.
In our sample, 69% of respondents lived with a partner or a spouse, while 31% did not - whether that was living alone, living with roommates, living with family, or another living arrangement. These two groups showed up very differently in the data.
Half of respondents without a partner at home reported ongoing financial instability (52%) - 15-points higher than those living with a partner (37%). Respondents without a partner at home were also twice as likely to worry about meeting their basic needs (20% compared to 40% - a 20-point difference). This makes sense, assuming that the single-income versus a dual-income distinction is the primary driver of these effects. One nonprofit income, paying almost $20,000 less than the Canadian norm on average, leaves no financial cushion. Having a second income in the home helps reduce that financial burden significantly.
What might be less intuitive, however, is the impact on burnout. Half of respondents (50%) without a partner at home reported burnout "often" or "extremely often" - 16-points higher than those 34% living with a partner (34%). Nonprofit women without a partner not only experienced more financial hardships at home, they also came home feeling more depleted and exhausted at the end of the day.
When we control for everything else, this was one of the greatest predictors of financial instability and burnout in the data. It paints a painful picture about the true reality of nonprofit salaries. Women in the nonprofit sector should not need a partner at home to feel like they are able to meet their basic needs, but our data suggests that might be a painful reality about our sector.
2. Whether they have caregiving responsibilities at home
The second factor that stood out above the rest was whether respondents had caregiving responsibilities at home. The Canadian Centre for Caregiving Excellence's recent Caring in Canada 2026 report highlighted how caregivers are the backbone of Canada's social care systems, and our data is no different. Across our sample, 61% of respondents were caregivers at home - i.e., they provided direct care at home for someone who depends on them. That's 3 in 5 women who after spending their days caring for their communities, went home to raise young children, support aging parents, care for a partner or adult child with a disability, or show up for a family member or friend who depends on them.
This means that caregiving in the norm, rather than the exception in the Canadian nonprofit sector. And caregivers faced notably higher strain - both financially and at work. For example:
-
-
35% of caregiving women worried about meeting their basic needs in the last 12 months compared to 23% of women without caregiving responsibilities - a 12-point difference.
-
40% of caregivers report foregoing retirement savings in that time compared to 27% of non-caregivers - a 13-point difference.
- 69% of caregivers report that their caregiving responsibilities had a clear effect on their experiences at work. Only 7% said they didn't have any effect at all.
-
The weight of caregiving responsibilities often bleed into the workday in tangible ways. We recently wrote about what we call the "spillover ladder" - the step-by-step ways that caregiving responsibilities can spill over into the workday - and the data shows that the more caregiving bleeds into someone's workday, the more likely they are to report frequent burnout at work.
However, the impact was not felt equally across all caregivers. We examined the differences across three caregiving groups:
- Nonprofit women caring only for young children
- Nonprofit women caring only for an aging parent, partner, or adult child with a disability or chronic condition
- The Sandwich Generation caring for both children and adult dependents
What did we find? Caring for children disrupts the workday the most. Seventy-seven percent of caregivers with children at home report that their caregiving responsibilities affect their experiences at work, 22-points higher than caregivers with disability and elder care responsibilities.
Disability and elder care, however, is more strongly linked to burnout. Women caring for adults had one of the highest burnout rates in our entire sample, with 44% reporting burnout "often" or "extremely often". This is compared to 30% of caregivers with children at home, essentially the same as nonprofit workers with no caregiving responsibilities at all.
This might feel counterintuitive, as you'd expect that the caregiving that most visibly disrupts the workday would be the one that burns people out the most. However, it all comes down to support and awareness. Caring for a child is demanding, but it’s bounded and socially recognized. Most managers understand school pickups and dentist appointments, and most Canadians can access parental benefits with job-protected leave guaranteed under labour laws. There may be regular disruption, but the support exists.
Caring for an aging parent or a partner with a chronic illness is different. It’s often open-ended, emotionally heavy, and largely invisible at work. "Eldercare leave" is almost unheard of with very limited government support. This type of caregiving rarely has discrete moments that fit into a calendar, it just quietly wears people down, week after week, with no built-in off-ramp. That's a recipe for burnout.
The Sandwich Generation, unfortunately, carries both of these challenges at once. Their work is disrupted at the same rate as the parent-only group and their burnout levels are equal to the group caring for adult dependents. They are squeezed on both fronts simultaneously, with no slack in either direction. Statistics Canada already counts roughly 1.8 million "sandwich" caregivers across Canada and that number is only set to grow as our population ages, with seniors projects to make up a quarter of Canadians by 2030.
And let's say the quiet part out loud: Women are still more likely to take on the majority of caregiving responsibilities, and even in households where there is a more even split in time, women still tend to carry the heavier, more recurring work of personal care. So when a sector that is primarily women asks its people to absorb more at work for less, it's asking them to do so on top of a second shift they were already carrying disproportionately at home.
Overall, this data provides a compelling case that working in the Canada nonprofit sector can comes at a significant cost - both in terms of financial well-being and overall well-being for many women. Importantly, however, these challenges also have a significant cost for our sector - and we need to be talking about it more.
The Cost of Our Compensation & Burnout Problem
People spend 90,000 hours of their lives at work, on average. Regardless of where we spend our own 90,000 hours, we all deserve to feel healthy at work and we all deserve a living wage. The nonprofit sector is comprised of hundreds of thousands of highly engaged, purpose-driven Canadians doing critical work in our communities - work that literally changes lives. If they cannot be healthy at work, nonprofit leaders are not succeeding in their jobs and that should be enough to raise alarm bells and warrant immediate action.
However, we also understand that inspiring action often requires putting literal dollars and cents to these problems. And so let's do the math on what is often one the most under-appreciated organizational costs: turnover.
The nonprofit workforce is the lynchpin that holds the entire sector together. No matter how innovative or revolutionary our new strategic plans are, how we integrate AI into our processes or streamline our operations, the progress and impact of a service-first sector will always be driven by its people first. And that's why the success of the Canadian nonprofit sector is dependent on our ability to recruit - and meaningfully retain - the right people.
Retention is not a new challenge in the Canadian nonprofit sector. For example, the Ontario Nonprofit Network's 2024 State of the Sector report found that the majority of nonprofits struggled with both recruitment and retention in the past year. The reality is, people who feel underpaid and burnout are often the first people to start considering their exit - a trend we've reported on in our data before. And it's exactly what we see across the women in this sample too.
To better understand the retention risk of women in the sector, we wanted to answer two critical questions:
-
-
What percentage of women are considering leaving the nonprofit sector altogether?
-
What percentage of women are looking to stay within the nonprofit sector but leave their current organization?
-
Let's start at the sector level. We asked all respondents: "Do you intend to be working in the nonprofit sector in 12 months?" - and the responses were staggering.
One in four (26%) of the women we surveyed were considering leaving the sector entirely in the next 12 months - with 7% having already made up their mind and an additional 19% considering leaving, but still unsure. That is a quarter of the workforce. Importantly, this finding does not change across leadership levels. Regardless of whether we are talking about senior leaders, middle managers, or front line employees, at least 20% of the women we measured were considering leaving their role. We often talk about the institutional knowledge organizations lose when someone leaves - but when experienced women leave the nonprofit sector altogether, that institutional knowledge leaves our sector too.
We then asked the remaining 76% who intended to stay within the nonprofit sector: "Do you intend to be working at your current organization in six months?" - and saw similar trends. A further 18% were considering leaving their current organization in the next half a year - with 4% already certain of leaving, and another 14% considering leaving.
Let's take a moment to consider those tow data points together. In total, more than 1 in 3 of the nonprofit women we surveyed (35%) were either questioning their future in the sector or questioning their future at their current organization.
That is a significant number and it should concern every nonprofit leader.
So we wanted to validate our hypothesis one more time. If value alignment and engagement are so high among women in the nonprofit sector, why does the sector have such a clear retention risk? We asked every respondent who was considering leaving the sector: "What are the main reasons why you are considering leaving the sector?" and asked them to select every reason from a list of 18 sector turnover drivers that applied to them.
We also asked every respondent who was considering leaving their organization: "What are the main reasons why you are considering leaving your organization?" and asked them to select every reason from a list of 15 organizational turnover drivers that applied to them.
The trends across both questions are remarkably similar, and they come back to the same story: Compensation and burnout are driving women out of the nonprofit sector and out of their organizations. Compensation was far and away the primary source of turnover intentions, with 3 in 5 respondents referencing pay as a key reason why they were considering leaving - particularly relative to the skills and experience that they bring to their role. They didn't just feel underpaid, they feel underpaid compared to the value and experience that they bring to their work.
Burnout is not far behind - with around half of respondents referencing chronic burnout and exhaustion as a key source of their turnover intentions.
There are interesting role-based differences at play here as well. For example, chronic burnout and exhaustion was the primary reason why senior leaders and directors were considering leaving both the sector (59%) or their organization (57%) - highlighting the significant burdens that senior women in this sector bear on a daily basis.
On the other hand, compensation was the primary reason why front line staff and supervisors were considering leaving both the sector (70%) or their organizations (100%) - highlighting the financial precarity that exists in the sector among women in less senior roles.
At it's core, however, the trend is the same:
Women in the Canadian nonprofit sector are underpaid and burnt out, and it is not only impacting their experience in the sector, it's driving them out of the sector entirely.
And that turnover comes at a significant cost.
In our last Workplace Well-Being Report, pay was the primary driver of turnover in a sample of almost 13,000 Canadian nonprofit employees across the full gender spectrum. That report focused on burnout and appreciation as two critical areas that nonprofits can control in under-funded environments, saying:
"We know there is only so much a nonprofit can do to address compensation in a significant way - that is why we often tell nonprofit leaders that if you can't match the compensation demands of your employees, you need to be providing a fantastic experience in the other areas of your culture. They need to feel as though they are receiving an experience that they wouldn't be able to receive elsewhere."
We still believe that to be true.
When compensation gaps exist, organizations need to fill that gap in other ways. Their employees need to feel like they are valued, like they are developing, and like they are getting the type of employee experience that gives them a genuine reason to stay - otherwise, why would they?
But, let's have the hard conversation. Let's talk compensation.
The Cost of the Compensation Problem
This is where we often see leaders' shoulders drop. Let's be clear: We've never met a nonprofit leader who wants to pay their people less. They know their pay is too low, but they are funded by project grants, thin margins, and donor restrictions, and compensation is the one line they feel they cannot touch in a meaningful way. Those are real constraints - pretending otherwise would simply be inaccurate.
So instead of arguing whether the sector can afford to pay its people more, let's look instead at what it is already paying not to.
Let's start with the size of the workforce. Canada's community nonprofit sector - the charities and community organizations that serve people directly (setting aside the hospitals, schools, universities, and colleges that tend to pay in different bands) - employs about 625,000 people across the country. Using Imagine Canada and Statistics Canada data, about 69% of them are women and female-identifying. That is roughly 430,000 women holding Canada's community nonprofit sector together.
Now let's talk retention. More than one in three women (35%) in our survey told us they are at risk of leaving - either questioning their future in the sector or questioning their role in their current organization - with compensation being the primary reason why women are considering leaving. Now, we know intention is not the same as action and we know not everyone will follow through on that. But if even half of them do, that is roughly 75,000 women leaving Canadian nonprofits in a single year - just shy of the capacity of the MetLife Stadium that held the 2026 World Cup final (click here to see just how many people that really is).
Now put a number on losing even one of them. Gallup puts the cost of replacing an employee at 40% to 200% of their annual salary once you consider the full costs of turnover: recruiting costs, onboarding, the productivity lost while the role sits empty, the months before a new hire is fully effective, and the institutional knowledge that needs to be replaced. Gallup breaks this out by role, with turnover of more seasoned and specialized employees carrying higher costs - 40% for frontline staff, 80% for professional and technical roles, and up to 200% for leadership. Because community nonprofits tend to be front-line heavy, we will anchor on the low end: 40% of salary as our conservative floor and 80% as our upper estimate. At an average community nonprofit salary of $43,020, that means each departure costs the sector somewhere between $17,000 and $34,000.
Even the most conservative estimates of this turnover clear a billion dollars every year - and that does not even account for the turnover of leaders.
The visualization below scales the annual replacement bill across a range of turnover rates using Gallup's frontline (40%) and professional (80%) rates.
-
-
17.5% of nonprofit women - half of the "at risk" group would see ~75,000 women leaving their organizations in the next year at an estimated cost of $1.3B to $2.6B to the sector.
-
26% of nonprofit women - 75% of the "at risk" group would see ~112,000 women leaving their organizations at an estimated cost of $1.9B to $3.9B.
- 35% of nonprofit women - the full "at risk" group would see ~151,000 women leaving their organizations at an estimated cost of $2.6B to $5.2B.
-
Here is the point we want to land the most. These numbers don't show up on balance sheets, but this money is not hypothetical. It is not money the sector might have to find - it is money the sector is already spending. Over a billion dollars quietly paid out in job postings, empty desks, and the slow re-learning of everything the last person knew. That money buys nothing. No new programs, no one new served - it just refills the same roles, again and again, because they keep emptying due to the same old compensation and burnout challenges across the sector.
So the choice has never been whether to "pay people more" or "spend nothing". The sector is already paying, at scale, for the consequences of underpaying its people. The real question is whether that money keeps being spent to replace the women who leave - or to actually keep them. We are not claiming a raise is free or easy - we know that it's not. But we are saying that the status quo already has a price tag in the billions, and it's important to remember that the sector is already covering that cost, one resignation at a time.



A Proud Part of the YMCA of Three Rivers
250 Hespeler Rd, Cambridge, ON
Contact us: workwell@ytr.ymca.ca